Identify Waste, Reduce Consumption, Improve Sustainability
Energy savings are typically derived from two sources: reduced energy cost and reduced energy usage. How can energy monitoring help achieve both?
- Lower peak demand will result in lower bills from both your local utility and from your 3rd party energy supplier. So it's a double saving. ePlanet provides the ideal tool for managing your peak demand — a heat map — to quickly and easily identify where and how peak demand is set.
- Lower energy consumption will lower bills by eliminating energy waste caused by human behavior, excessive equipment operation, and even finding machine inefficiency.
Identifying Peak Demand
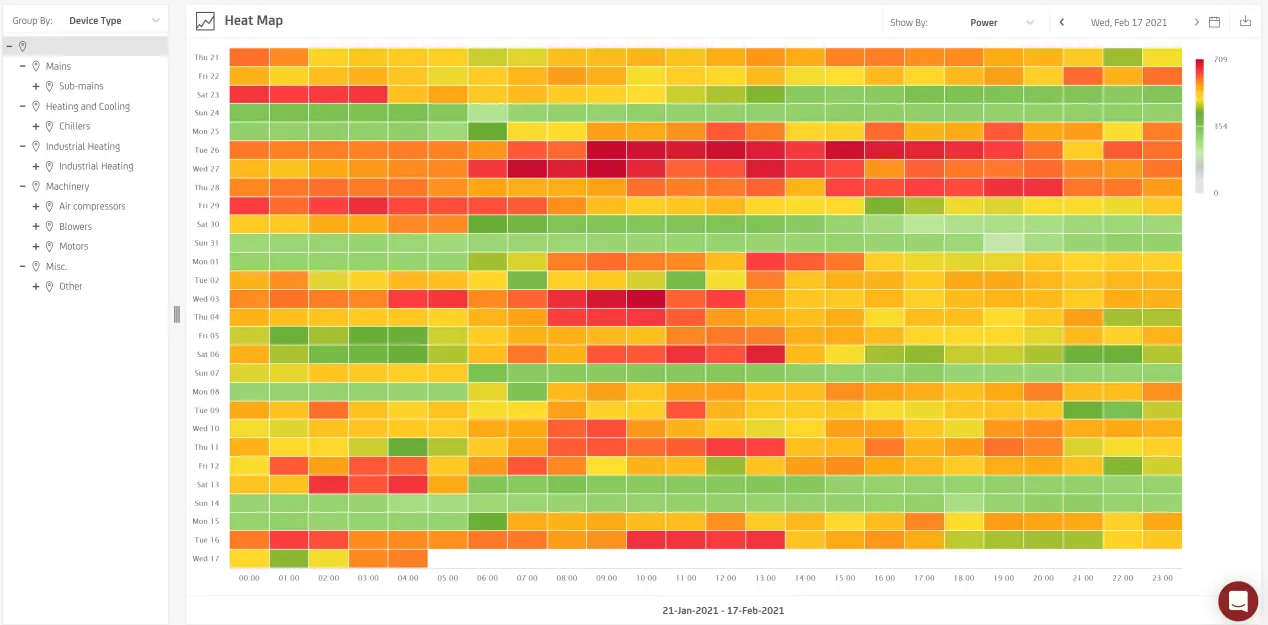
When does peak demand happen and which machines are contributing? With equipment-level energy monitoring, a site can identify the exact machines running when peak demand is set.
This heat map represents a site's energy use over a month long period, with the green to red color scale representing low to high demand. To avoid peak charges, this customer seeks to avoid high demand between noon and 6 PM on weekdays. SW360 can identify the equipment running during those periods, allowing the customer to decide whether to power down equipment.
Which loads increased peak demand? SW360 identified an additional compressor that was energized erroneously, resulting in multiple new peaks:
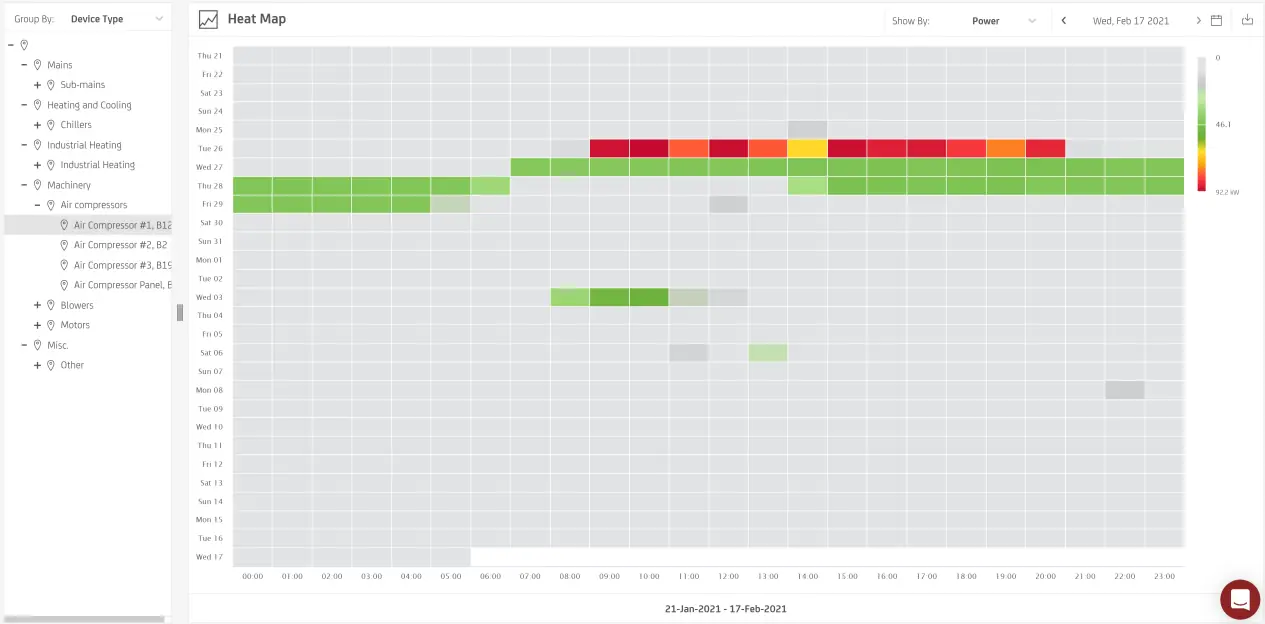
Are there compressors or grinders or other machinery that can shift operation away from the main production shift? Are there conveyors or chillers running that do not have to be? Are standby loads contributing significantly to peak loads?
Finding Energy Waste
Energy waste is caused by several factors, including:
- Human behavior
- Excessive machine run-time
- Inefficient operation
Human Behavior
- Leaving equipment running when it should be switched off — at night, weekends, during shift changes etc. Are you certain that your lights are off when the facility is idle? What about the rooftop A/C units? What about equipment in a remote building?
- Operating equipment incorrectly. Identify experienced versus inexperienced operators by observing the efficiency of their machine operation.
Excessive Machine Run Time
Are machines required to run continuously due to a critical need, or are they simply left on because that's how the site has always operated? Do you know the cost of keeping those machines running?
SW360 typically compares ON (occupied) to OFF (unoccupied) operation to see if there are machines or equipment left to run that do not need to be. Through automated and customized reporting, customers gain insight into potential energy savings from reducing unneeded and unwanted machine operation.
For an existing customer, SW360 used energy monitoring to find 50 kW in unneeded thermoforming-press energy use during weekends and overnight hours. Reducing the excessive 50 kW during non-production hours at a cost of $0.13 per kWh for 2,150 hours per year results in $14,000 annual savings!
Inefficient Operation
Machine settings and mechanical inefficiencies are significant sources of waste. Compressed air systems are notorious energy wasters due to near-continuous leakage. Since these systems operate around the clock, quantifying the potential savings from addressing leaks (and keeping them repaired) is crucial to instituting energy saving maintenance programs.
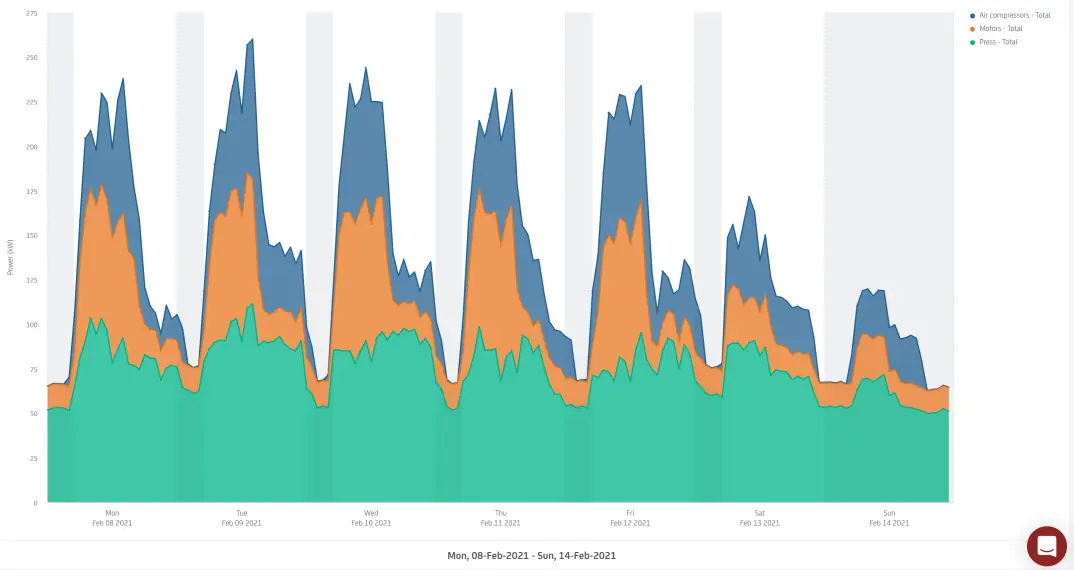
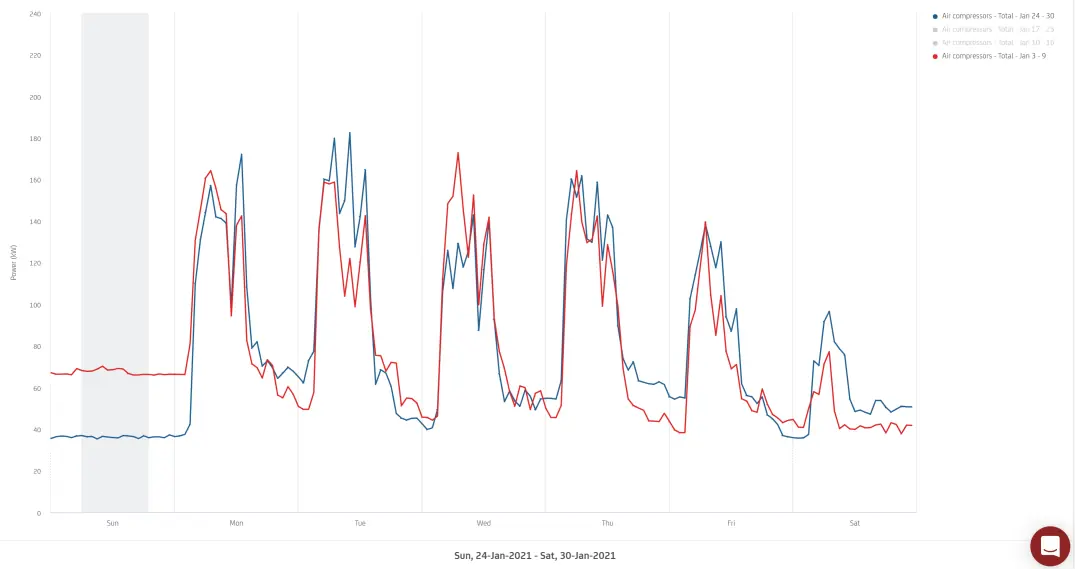
For one current ePlanet customer, compressors were a large portion of their overall energy usage. Using active energy monitoring, the site was able to quantify leaks in a baseline period (the red line below) and show how repairs resulted in energy savings (the blue line below). The energy reduction on non-production days (Sunday below) is 30 kW, for all future operating hours, amounting to savings of more than $20,000, which paid for their SW360 installation in a matter of months!
FAQ
Yes, SW360 can display detailed data showing where energy is likely being wasted through unnecessary run-time, etc.
Depending on your utility, roughly 1/3 of your bill is for (peak) demand and 2/3 for overall kWh usage.
If you know when you're setting peaks, you can shift part/all of the load to other times of day by staggering machine start-ups or moving loads from peak to off-peak.
Yes you can create an up-to-the minute report at any time with a single click - on the first day of the following month if you want.
Yes, you can set an alert to warn you if any machine that's being monitored runs during a particular time period.